


Blog
What is Raman Spectroscopy?

Raman Spectroscopy is a non-destructive chemical analysis technique which provides detailed information about chemical structure, phase and polymorphy, crystallinity and molecular interactions. It is based upon the interaction of light with the chemical bonds within a material.
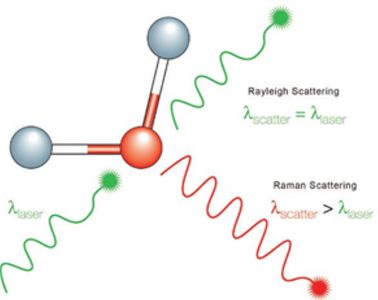
Raman is a light scattering technique, whereby a molecule scatters incident light from a high intensity laser light source. Most of the scattered light is at the same wavelength (or color) as the laser source and does not provide useful information – this is called Rayleigh Scatter. However a small amount of light (typically 0.0000001%) is scattered at different wavelengths (or colors), which depend on the chemical structure of the analyte – this is called Raman Scatter.
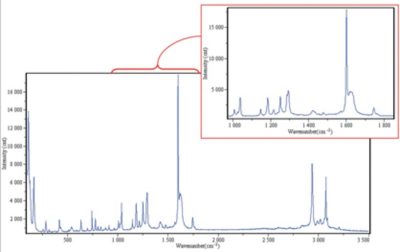
A Raman spectrum features a number of peaks, showing the intensity and wavelength position of the Raman scattered light. Each peak corresponds to a specific molecular bond vibration, including individual bonds such as C-C, C=C, N-O, C-H etc., and groups of bonds such as benzene ring breathing mode, polymer chain vibrations, lattice modes, etc.
Information provided by Raman spectroscopy
Raman spectroscopy probes the chemical structure of a material and provides information about:
- Chemical structure and identity
- Phase and polymorphism
- Intrinsic stress/strain, Contamination and impurity
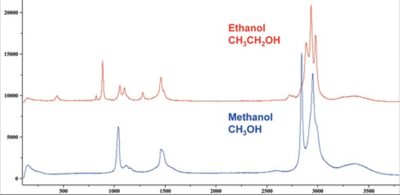
Typically a Raman spectrum is a distinct chemical fingerprint for a particular molecule or material, and can be used to very quickly identify the material, or distinguish it from others. Raman spectral libraries are often used for identification of a material based on its Raman spectrum – libraries containing thousands of spectra are rapidly searched to find a match with the spectrum of the analyte.
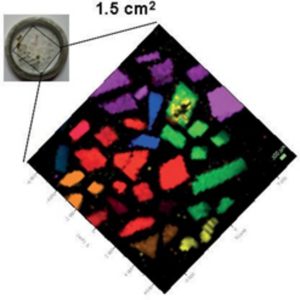
In combination with mapping (or imaging) Raman systems, it is possible to generate images based on the sample’s Raman spectrum. These images show distribution of individual chemical components, polymorphs and phases, and variation in crystallinity.
Raman spectroscopy is both qualitative and quantitative.
The general spectrum profile (peak position and relative peak intensity) provides a unique chemical fingerprint which can be used to identify a material, and distinguish it from others. Often the actual spectrum is quite complex, so comprehensive Raman spectral libraries can be searched to find a match, and thus provide a chemical identification.
The intensity of a spectrum is directly proportional to concentration. Typically, a calibration procedure will be used to determine the relationship between peak intensity and concentration, and then routine measurements can be made to analyze for concentration. With mixtures, relative peak intensities provide information about the relative concentration of the components, while absolute peak intensities can be used for absolute concentration information.
Raman is used for microscopic analysis
Raman spectroscopy can be used for microscopic analysis, with a spatial resolution in the order of 0.5-1 µm. Such analysis is possible using a Raman microscope.
A Raman microscope couples a Raman spectrometer to a standard optical microscope, allowing high magnification visualization of a sample and Raman analysis with a microscopic laser spot. Raman micro-analysis is easy: simply place the sample under the microscope, focus, and make a measurement.

A true confocal Raman microscope can be used for the analysis of micron size particles or volumes. It can even be used for the analysis of different layers in a multilayered sample (e.g., polymer coatings), and of contaminants and features beneath the surface of a transparent sample (e.g., impurities within glass, and fluid/gas inclusions in minerals).
Motorized mapping stages allow Raman spectral images to be generated, which contain many thousands of Raman spectra acquired from different positions on the sample. False color images can be created based on the Raman spectrum – these show the distribution of individual chemical components, and variation in other effects such as phase, polymorphism, stress/strain, and crystallinity.
History of Raman microscopy
HORIBA Scientific now incorporates the major innovators of Raman instrumentation from the 1960s to the 1990s – Spex Industries, Coderg/Lirinord/Dilor, and Jobin Yvon. From these beginnings through to the present day, HORIBA Scientific and its associated companies have been at the forefront of the development of Raman spectroscopy.
The Raman microscope was developed in Lille, France under the direction of Professor Michel Delhaye and Edouard DaSilva, and was commercially produced as the MOLE™ (Molecular Optics Laser Examiner) by Lirinord (now HORIBA Scientific). It developed as the molecular analog of Castaing’s electron microscope. As such it provides bonding information on condensed phase materials; in addition to detection of molecular bonding, identification of the crystalline phase and other more subtle effects also proved of significant interest.
The microscope was initially integrated with the scanning double grating monochromator (c. 1972). When high sensitivity, low noise multichannel detectors became available (mid 1980s), triple stage spectrographs were introduced with the microscope as an integrated component. In 1990 the holographic notch filters were demonstrated to provide superior laser rejection so that a Raman microscope could be built on a single stage spectrograph and provide enhanced sensitivity. Compared with the original scanning double monochromators, collection times for comparable spectra (resolution and signal to noise for a given laser power) is now at least two to three orders of magnitude higher than what it was 35 years ago.
These core innovations have been pioneered in the HORIBA Scientific labs in northern France by the scientists and engineers who were trained in Professor Delhaye’s laboratory, taking advantage of hardware as it came available. This included holographic gratings, notch filters, air-cooled lasers, multichannel detectors (first intensified diode arrays and then CCDs), high power computers, and associated developments in electronics and software.
More recent developments in the Raman technique include SRS (Stimulated Raman Scattering), SERS (surface enhanced Raman scattering), TERS (tip enhanced Raman scattering), integration with electron microscopes and atomic force microscopes, hybrid single bench systems (e.g., Raman-PL, Epifluorescence, Photocurrent), Transmission Raman (for true bulk material analysis).
Because of the leadership that HORIBA Scientific and its associated companies have played in the industry, well- equipped applications laboratories with highly qualified scientists have been employed continuously for more than 30 years in developing the applications of these innovative instruments.
Type of samples analyzed with Raman
Raman can be used to analyze many different samples. In general it is suitable for analysis of:
In general it is not suitable for analysis of:
Analysis of solids, liquids and gases
Raman spectra can be acquired from nearly all samples which contain true molecular bonding. This means that solids, powders, slurries, liquids, gels and gases can be analyzed using Raman spectroscopy.
Although gases can be analyzed using Raman spectroscopy, the concentration of molecules in a gas is typically very low, so the measurement is often more challenging. Usually specialized equipment such as higher powered lasers and long path length sample cells are necessary. In some cases where gas pressures are high (such as gas inclusions in minerals) standard Raman instrumentation can easily be used.
Analysis from a mixture of materials
The Raman spectrum from a material will contain Raman information about all of the molecules which are within the analysis volume of the system. Thus, if there is a mixture of molecules, the Raman spectrum will contain peaks representing all of the different molecules. If the components are known, the relative peak intensities can be used to generate quantitative information about the mixture’s composition. In case of complex matrixes, chemometrics methods might also be employed to build quantitative methods.

